Music Industry – Markets & Sales Data 2014
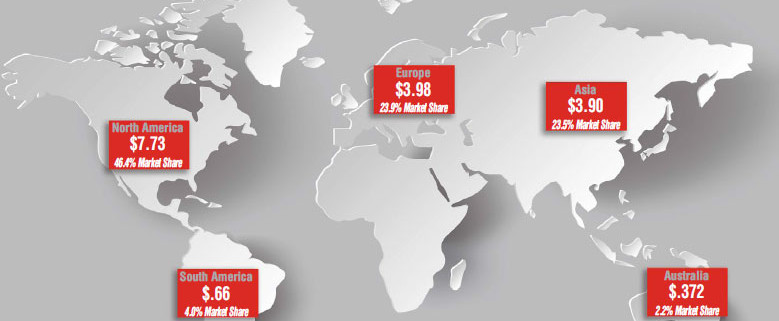
Image above gives figures in millions of dollars, representing estimated retail sales volume in each region.
How the music industry looks today in 2014
One thing is for sure this competitive industry has ridden out the global economic downturn of 2009 and has continued to provide us with an ever exciting array of products with cutting-edge technology at reasonably affordable prices.
The following data compares the Global turnover of the top 10 companies in the Music Industry during the last 5 or so years. The tables below show how the company revenue & ranking may have fluctuated. Notice how Gibson has moved up, this may be to do with their purchase of certain audio companies during recent years.
Top Ranked Music Companies 2009
| Rank 2009 | Rank 2008 | Company | Estmiated Revenues 2009 |
|---|---|---|---|
| 1 | 1 | YAMAHA | $4,322,356,000 |
| 2 | 2 | ROLAND CORPORATION | $921,523,772 |
| 3 | 4 | KAWAI MUSICAL INSTRUMENTS MFG. CO., LTD. | $688,373,467 |
| 4 | 3 | FENDER MUSICAL INSTRUMENTS | $600,750,000 |
| 5 | 5 | HARMAN PROFESSIONAL | $493,000,000 |
| 6 | 6 | SENNHEISER ELECTRONIC | $452,000,000 |
| 7 | 7 | SHURE INC. | $395,000,000 |
| 8 | 8 | STEINWAY MUSICAL INSTRUMENTS | $306,436,000 |
| 9 | 9 | GIBSON GUITAR CORP. | $287,500,000 |
| 10 | 11 | KHS/MUSIX CO. Ltd. | $279,000,000 |
Top Ranked Music Companies 2013
| Rank 2013 | Rank 2012 | Company | Estmiated Revenues 2013 |
|---|---|---|---|
| 1 | 1 | YAMAHA | $3,755,767,000 |
| 2 | 3 | ROLAND CORPORATION | $783,600,000 |
| 3 | 2 | SENNHEISER ELECTRONIC | $738,000,000 |
| 4 | 7 | GIBSON BRANDS | $735,679,000 |
| 5 | 4 | FENDER MUSICAL INSTRUMENTS | $677,300,000 |
| 6 | 5 | HARMAN PROFESSIONAL | $672,805,000 |
| 7 | 6 | KAWAI MUSICAL INSTRUMENTS MFG. CO., LTD. | $536,341,000 |
| 8 | 8 | SHURE INC. | $462,000,000 |
| 9 | 9 | STEINWAY MUSICAL INSTRUMENTS | $373,600,000 |
| 10 | 11 | MUSIC GROUP | $340,000,000 |
Top Ranked Music Companies 2014
| Rank 2014 | Rank 2013 | Company | Estmiated Revenues 2014 |
|---|---|---|---|
| 1 | 1 | YAMAHA | $3,586,770,000 |
| 2 | 4 | GIBSON BRANDS | $2,089,700,000 |
| 3 | 6 | HARMAN PROFESSIONAL | $853,140,000 |
| 4 | 3 | SENNHEISER ELECTRONIC | $695,280,000 |
| 5 | 5 | FENDER MUSICAL INSTRUMENTS | $675,000,000 |
| 6 | 7 | KAWAI MUSICAL INSTRUMENTS MFG. CO., LTD. | $550,240,000 |
| 7 | 8 | SHURE INC. | $490,000,000 |
| 8 | 9 | STEINWAY MUSICAL INSTRUMENTS | $398,700,000 |
| 9 | 10 | MUSIC GRUOP | $365,000,000 |
| 10 | 2 | ROLAND CORPORATION | $357,240,000 |
Markets & Manufacturing
Just six or so countries manufacture close to 90% of the world’s music and audio gear. They are the United States, China, Taiwan, Japan, South Korea, and Indonesia.
Trading figures gathered by the World Trade Organisation (W.T.O.) produce an interesting outline of where the industry is most concentrated.
Top Countries
| Country | No’ of Companies | Sales | % Share of Global Sales |
|---|---|---|---|
| JAPAN | 28 | $6,505,467,634 | 33.42% |
| USA | 81 | $6,136,565,400 | 31.53% |
| GERMANY | 19 | $1,598,317,000 | 8.21% |
| CHINA | 22 | $1,249,711,901 | 6.42% |
| HONG KONG | 4 | $766,452,000 | 3.94% |
| TAIWAN | 8 | $502,225,000 | 2.58% |
| SOUTH KOREA | 6 | $367,950,000 | 1.89% |


